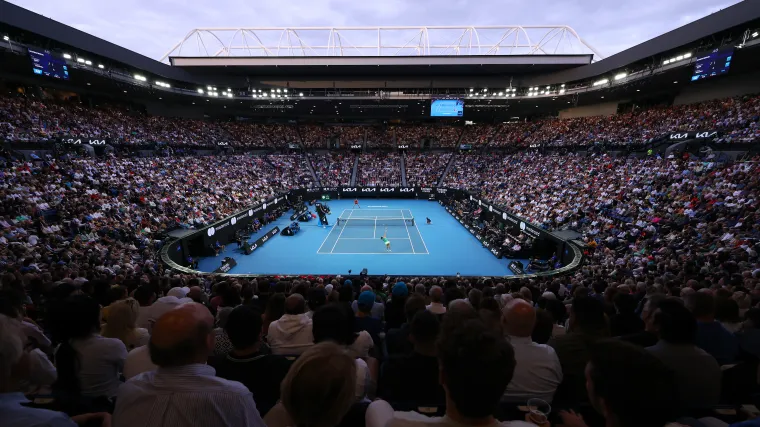
The Australian Open is getting bigger every year with organisers again hoping for a record crowd.
Records have already been smashed in the Opening Week – before the main draw singles even begin.
Will the Australian Open continually be one of the best events on the Australian sporting calender?
The Sporting News has all the details on the Melbourne Park crowd figures.
MORE: Australian Open qualifying LIVE 2026: Scores, schedule, draw, results, bracket
Australian Open 2026 crowd numbers, attendance
Qualifying/Opening week
| Date | Attendance | Notes |
| Jan 12 | 29,261 | 7,543 was previous record (2025) |
| Jan 13 | 34,209 | 18,129 was previous record (2025) |
| Jan 14 | 36,973 | 21,432 was previous record (2025) |
| Jan 15 | 35,805 | 25,721 was previous record (2025) |
| Jan 16 | 39,343 | 23,716 was previous record (2025) |
Main Draw
| Date | Attendance | Running total |
| Day 1 (Jan 18) | ||
| Day 2 (Jan 19) | ||
| Day 3 (Jan 20) | ||
| Day 4 (Jan 21) | ||
| Day 5 (Jan 22) | ||
| Day 6 (Jan 23) | ||
| Day 7 (Jan 24) | ||
| Day 8 (Jan 25) | ||
| Day 9 (Jan 26) | ||
| Day 10 (Jan 27) | ||
| Day 11 (Jan 28) | ||
| Day 12 (Jan 29) | ||
| Day 13 (Jan 30) | ||
| Day 14 (Jan 31) | ||
| Day 15 (Feb 1) |
Melbourne Park court capacities: Australian Open 2026
There are 39 courts at Melbourne Park – 33 hard courts and six clay (which are not in use during the tournament).
The major on-site venues include Rod Laver Arena, Margaret Court Arena and John Cain Arena
| Court | Capacity (approx.) |
| Rod Laver Arena | 15,000 |
| John Cain Arena | 9,600 |
| Margaret Court Arena | 7,500 |
| Kia Arena | 5,000 |
| 1573 Arena | 3,000 |
| ANZ Arena | 3,000 |
Which Australian Open courts have roofs?
Three venues at Melbourne Park have roofs – Rod Laver Arena, Margaret Court Arena and John Cain Arena.
These roofs can be closed in the event of extreme heat or rain.
Australian Open total attendance figures since 2000
| Year | Attendance |
| 2025 | 1,102,303 |
| 2024 | 1,020,763 |
| 2023 | 839,192 |
| 2022** | 346,468 |
| 2021* | 130,374 |
| 2020 | 812,174 |
| 2019 | 796,435 |
| 2018 | 743,667 |
| 2017 | 728,763 |
| 2016 | 720,363 |
| 2015 | 703,899 |
| 2014 | 643,280 |
| 2013 | 684,457 |
| 2012 | 686,006 |
| 2011 | 651,127 |
| 2010 | 653,860 |
| 2009 | 603,160 |
| 2008 | 605,735 |
| 2007 | 554,858 |
| 2006 | 550,550 |
| 2005 | 543,873 |
| 2004 | 521,691 |
| 2003 | 512,225 |
| 2002 | 518,248 |
| 2001 | 543,834 |
| 2000 | 501,251 |
**Crowds were restricted to 50 per cent of overall capacity due to COVID-19.
*Crowds were allowed to attend only on nine of the 14 days and were restricted to 30-50 per cent of overall capacity due to COVID-19.